
Survey of Online Shopping Usage Trends in 10 Asian cities 2021
Today’s Topic |
Live commerce seems to be used unexpectedly in Asian cities except Tokyo! |
transcosmos conducted the "Survey of Online Shopping Usage Trends in 10 Asian cities 2021" with the aim of exploring the actual usage of online shopping in Asia and interest in cross-border EC. The survey targets 3,200 online shopping users in 10 Asian cities (320 from each city) including Tokyo, and clarifies the characteristics of the cities and trends common to Asia. This year, which is the fourth year, we researched the two themes of "live commerce" and "changes in actions due to the COVID-19," and here we would like to introduce each of the points to be featured.
* This article is a reprint of the article posted on the transcosmos research department official blog on March 15, 2021.(link available in Japanese only) |
Points to watch when using live commerce - More than half of the respondents in Hanoi (62.5%), Bangkok (60.6%) and Mumbai (52.5%) answered they had made a purchased using live commerce, while Tokyo and Asian cities, only 5.9% had. The difference became remarkable. - On the other hand, in the "happy experience" article that represents the user would want to use it again, "packing was neat" was the chosen the most in Tokyo (32%) and Shanghai (43%), while in the other 8 cities, "the shipping was free while it was supposed to be charged" was the most, which was a very high score of 60 to 70%. ~ Looking at the average of the 10 cities on live commerce, "I can ask for explanations that are difficult to understand on images and texts" (65.2%), "When shopping, I can immediately check any unclear or uncertain points." (57.3%), "I can watch demonstrations of how to use the product" (50.9%), and other characteristics that are unique to live video are highly evaluated. Also, in Shanghai and Mumbai, the fun of supporting their favorite celebrities and distributors is also attractive. - As for the reason for not using it, "the timing of delivery often isn't good" (41.4%) was the most common result in the average of the 10 cities. On the other hand, the reasons for shopping style preferences such as "I want to shop carefully" and "I don't like it because it looks like TV shopping" were also listed in the top range. |
|
Table of contents
|
Live commerce familiarity exceeds 70% in 9 cities
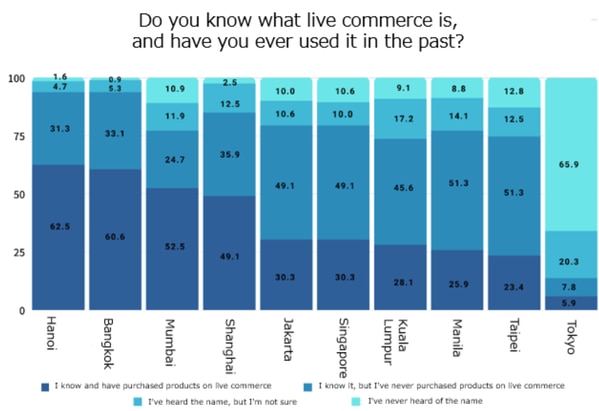
When they were asked about the familiarity and usage experience of live commerce in each Asian city, the familiarity was over 70% in 9 of the 10 cities excluding Tokyo. In particular, in the three cities of Hanoi (62.5%), Bangkok (60.6%) and Mumbai (52.5%), more than half of the respondents have purchased with live commerce. In the other 5 cities, the usage rate is less than half, and the usage rate in Tokyo and Taipei is low, only about 20%. Particular, Tokyo had less familiarity and usage than the other cities. 5.9% of Tokyo's respondents had purchased. 7.8% of Tokyo's respondents had not, but recognized it (chart.1).
Chart.1 Live commerce familiarity and usage rate (%)

Detailed product description boosts the use of live commerce, and influencers have a great influence in Shanghai and Mumbai
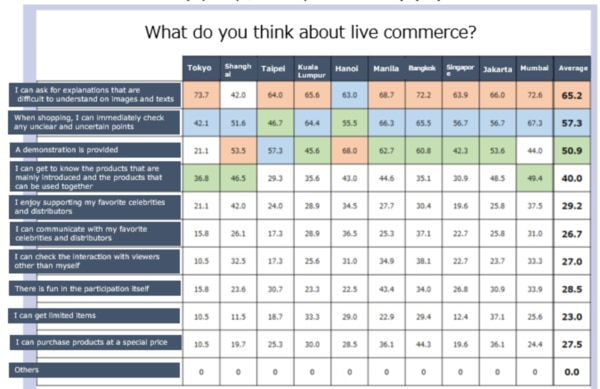
~ Looking at the average of the 10 cities on live commerce, "I can ask for explanations that are difficult to understand on images and texts" (65.2%), "When I shop, I can immediately check any unclear or uncertain points." (57.3%), "Demonstration of how to use the product" (50.9%), and other characteristics that are unique to live video are highly evaluated. In eight cities excluding Shanghai and Hanoi, the answer "They can ask for explanations that are difficult to understand on images and texts" was ranked first, and we were able to find that the benefits of being able to receive detailed product explanations is the reason for using live commerce. In addition, the overall average response rate was less than 30%. However, many respondents said that they enjoyed supporting their favorite celebrities and distributors in Shanghai (42.0%) and Mumbai (37.5%). You can see the high influence of the influencers (Chart.3)
Chart 2. Impressions about using live commerce (overall average / multiple answers) (%)
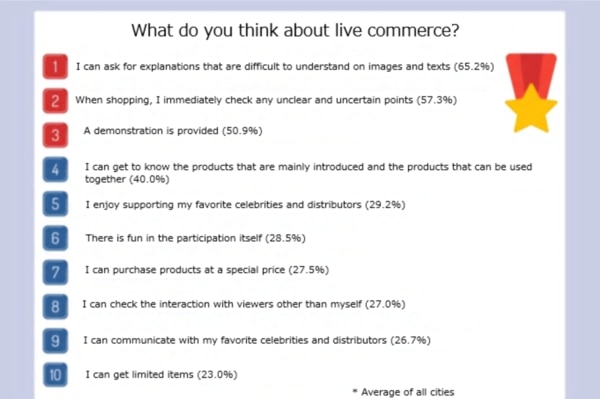
Chart 3. Impressions regarding the use of live commerce (by city / multiple answers) (%)
The main reason for not using live commerce is the timing of delivery
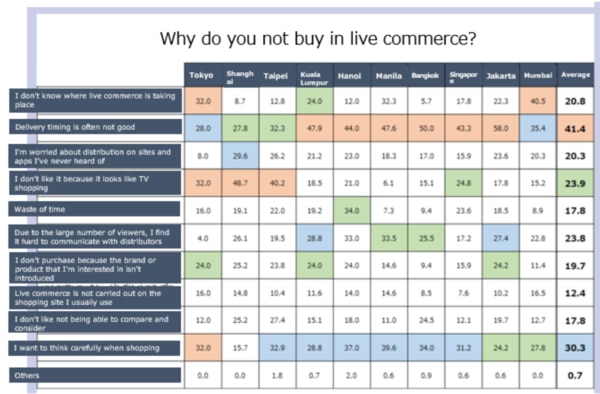
When we asked why they do not use live commerce to the respondents who knew about live commerce but had never used it, (1) "The timing of delivery is often isn't good" (41.4%), (2) "I want to shop carefully" (30.3%), and (3) “I don't like it because it's like TV shopping” (23.9%) were in the top range (Chart.4). The most frequently answered "often the timing of delivery isn't good" is as follows: Jakarta (58.0%) and Bangkok (50.0%), Kuala Lumpur (47.9%), Manila (47.6%), Hanoi (44.0%), Singapore(43.3%). This is the biggest reason for not using it in 6 cities. On the other hand, in the three cities of Shanghai (48.7%), Taipei (40.2%), and Tokyo (32.0%), "I don't like it because it's like TV shopping" was the biggest reason why they don't use it (Chart.5).
Chart 4. Reasons for not using live commerce (overall average / multiple answers) (%)
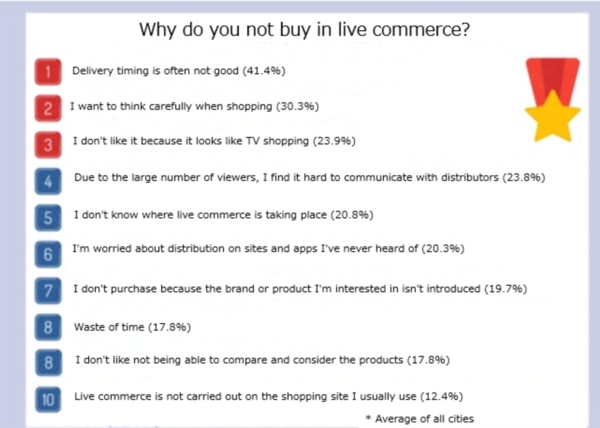
Chart 5. Reasons for not using live commerce (by city / multiple answers) (%)
People who have no experience of using live commerce have a low intention to use it in the future
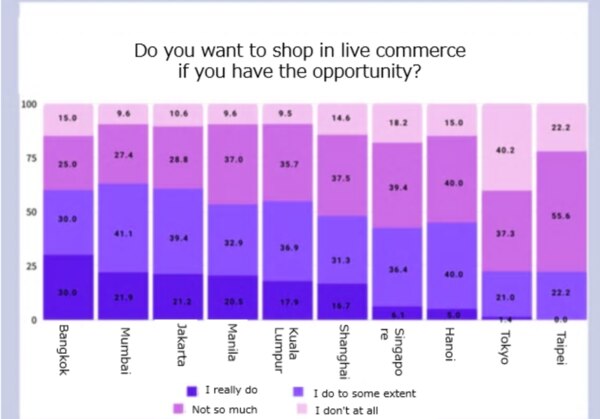
When we explained the definition of live commerce to the respondents who did not know about live commerce and asked about their intention to use it in the future, more than half of the respondents indicated their intention to use live commerce in five cities, Mumbai (63.0%), Jakarta (60.6%), Bangkok (60.0%), In five cities, Kuala Lumpur (54.8%) and Manila (53.4%) in the future. On the other hand, in the other five cities, the intention to use live commerce, especially in Tokyo (22.5%) and Taipei (22.2%), was low, less than half (Chart.6).
Chart 6. Future intention to use live commerce (by city) (%)
|
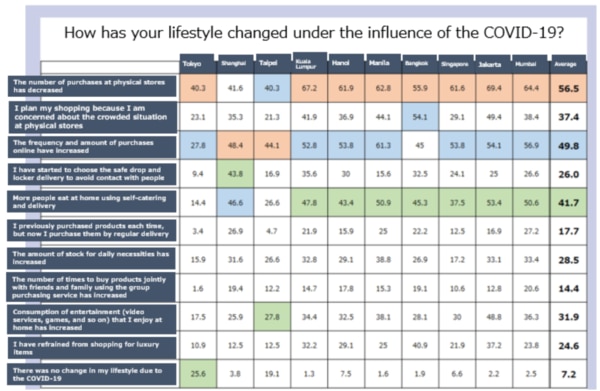
Points to watch of changes in the lifestyle due to the COVID-19
- The main impacts to the lifestyle due to the COVID-19 were "the number of purchases at physical stores has decreased" (56.5%), "the frequency and amount of online purchases have increased" (49.8%), and "the number of people who eat at home using self-catering and online delivery has increased" (41.7%). It is clear that the increase in the time spent at home has lead people to shift from physical stores to online shopping. - This tendency is supported by the large increase in the frequency of shopping, which is continuously measured every year, regardless of the scale of the epidemic of the COVID-19 in each city and the strictness of behavioral regulations.
- As for the genre that increased by online purchase, "daily necessities / toiletries" was the highest in 10 cities with an average of 50.4%, and "food delivery" was ranked first in Manila, Hanoi, Kuala Lumpur, and Bangkok. |
Under the influence of the COVID-19, shopping at physical stores has decreased and online usage has increased.
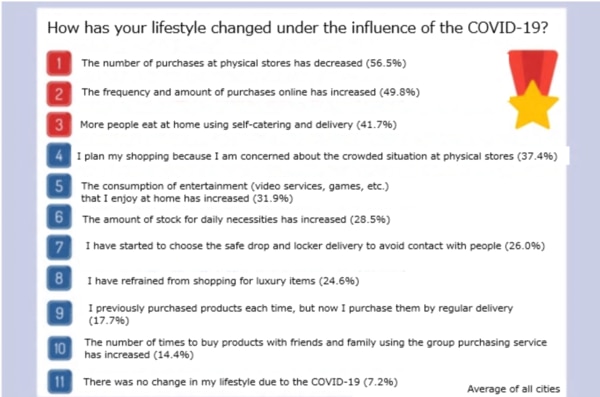
When asked about how the COVID-19 affected their lives, (1) "the number of purchases at physical stores has decreased" (56.5%), (2) "the frequency and amount of online purchases has increased" (49.8%), (3) "the frequency of eating at home using self-catering and online delivery has increased" (41.7%) was ranked high. We found that the numbers of online shopping are increasing (Chart.7).
Chart 7. Changes to the lifestyle caused by the COVID-19 (overall average / multiple answers) (%)
"Decreased number of shopping at physical stores" was ranked first in 8 cities excluding Shanghai and Taipei. About 60% of those cities answered in 7 cities excluding Tokyo. While the lifestyle changes due to the COVID-19 are seen overall, in Tokyo, "there were no changes in the lifestyle due to the COVID-19" was the third option. We found that there were many answers from the respondents who did not feel any change compared to other cities. (Chart.8).
Chart 8. Changes in the lifestyle due to the COVID-19 (by city / multiple answers) (%)
In addition, we asked the respondents who answered that the COVID-19 had changed their lifestyle, about the products that they purchase online more than before. (1) "Daily necessities / toiletries" (50.4%), (2) "Food delivery" (47.0%), (3) "Food / beverages / alcohol" (46.3%), (4) "Fashion (apparel, bags, accessories, etc.)" (44.4%), (5) “Cosmetics / Pharmaceuticals” (34.8%) ranked high (Chart.9).
Chart 9. Top 10 products with increased numbers in online purchases affected by the COVID-19 (overall average / multiple answers)
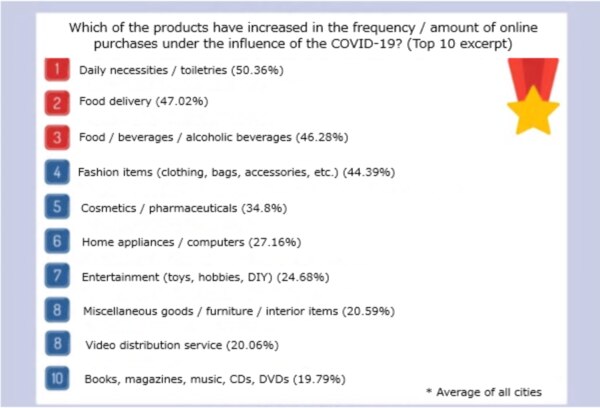
Particularly, more than 50% of the respondents answered that the frequency and amount of online purchases for "daily necessities / toiletries", which ranked first, increased in 9 cities except Tokyo. In terms of "food delivery," which ranked second, it ranked first in Manila (61.6%), Hanoi (61.5%), Kuala Lumpur (60.4%), and Bangkok (59.6%)
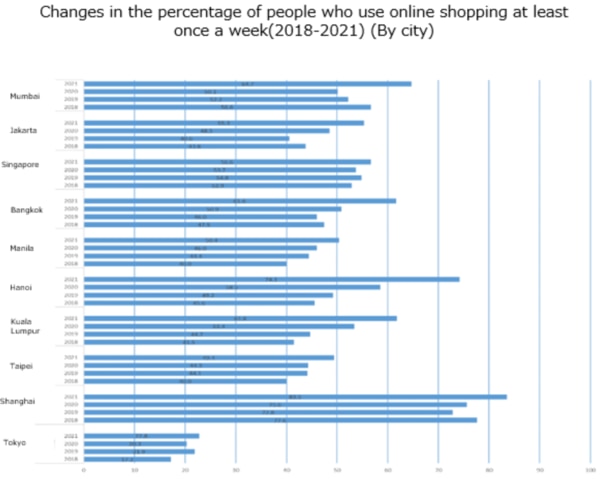
Comparing the use of online shopping from 2018 to 2021 over the years, we found that the average number of how many times online shopping was used per month is increasing in all cities. As of 2018, only 3 cities, Mumbai, Singapore, and Shanghai, had more than 50% of respondents shopping online at least once a week, while in 2021, there were 8 cities excluding Tokyo and Taipei (Chart. 10).
Chart 10. Changes in the percentage of people who use online shopping at least once a week (2018-2021) (by city / multiple answers) (%)
|
- About "Survey of Online Shopping Usage Trends in 10 Asian cities 2019"
Survey method: Online panel survey Surveyed cities: 10 cities; Japan (Tokyo), China (Shanghai), Taiwan (Taipei), Indonesia (Jakarta), Singapore (Singapore), Thailand (Bangkok), Malaysia (Kuala Lumpur), Vietnam (Hanoi), Philippines (Manila), India (Mumbai) Survey target: Men and women from teenagers to 40s who have used (purchased) online shopping within the last year Number of samples collected: 320 x 10 cities = 3,200 samples in total Survey period: December 25, 2020 - January 12, 2021 |
While this survey revealed that the familiarity and usage rate of live commerce in Asian cities is surprisingly high, the low familiarity and usage intention of Tokyo is remarkable.
There are several possible causes for this difference. First, the situation of the seller side is that major online shopping sites with the ability to attract many customers have not yet fully integrated live commerce in Japan. In addition, we can infer that the user side is also affected by the relatively high reliability of domestic online shopping sites and the tendency to still prefer to purchase at physical stores.
However, even in Japan, Shiseido and major department stores have recently been actively entering live commerce, triggered by refraining from going out due to the spread of the COVID-19. In addition, there is a tendency for users to reduce shopping at physical stores and increase the use of online shopping, and live commerce, which allows users to experience the same customer service as stores, will gradually spread as a new purchasing style.
transcosmos is a global and one-stop solution provider that offers digital marketing, 5A analysis, eCommerce and contact center support that adds value through optimizing cost and driving sales. For more information, please feel free to email us at; |
Let’s talk ✉:sales_global@ml01.trans-cosmos.co.jp |